
By Professor Andrew Tatem FAcSS (Professor of Spatial Demography and Epidemiology, University of Southampton and Director of WorldPop and Flowminder)
This article was originally commissioned and published by the Campaign for Social Science as part of its COVID-19 programme. See the original here.
COVID-19 is breaking records for its speed of global domination – what are the changes in global connectivity behind this and how can we measure them?
It took thousands of years for humans to reach all corners of the planet. At the time of writing, it has taken the tiny SARS-CoV-2 coronavirus that causes COVID-19 disease just a few weeks to reach nearly every country in the World. Possibly it has succeeded already. How does this compare to previous pandemics, why are there differences and how can we capture measurements on key driving factors? A better understanding of these factors is important for planning our future with COVID-19, and for our abilities to mitigate the impacts of future outbreaks.
Rising pandemic pace
Pandemics are nothing new – most of us have lived through a few disease outbreaks that have spread over multiple countries or continents, meeting the definition of a pandemic. These have taken multiple forms, with great variation in factors such as geographical extents, timescales and death tolls. One apparent pattern is an increasing frequency by which disease outbreaks become pandemics and a growing speed of spread of the pathogens involved. The timescales of continental or global spread of three pandemics involving smallpox, bubonic plague and influenza are mapped out in figure 1.
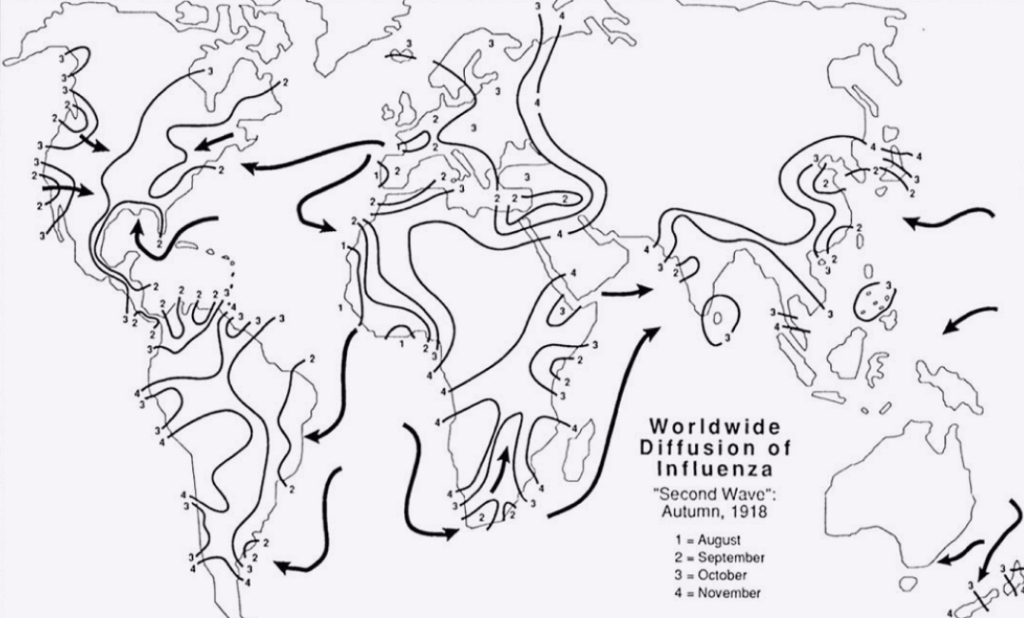
Despite all being pretty infectious, the maps in figure 1 show orders of magnitude changes in the speeds with which each pathogen spread across continents. Smallpox took centuries to spread from its endemic zones in Asia to reach Europe and Africa. The pandemic of bubonic plague, named ‘the Black Death’ in the 14th century took around 15 years to spread from its apparent origin in China to the far reaches of Western Europe. The influenza pandemic of 1918 then took just a few months to spread globally. Contrast these to recent pandemics, including SARS, H1N1 (‘Swine Flu’) and now SARS-CoV-2, where spread to the other side of the globe has occurred within days and weeks.
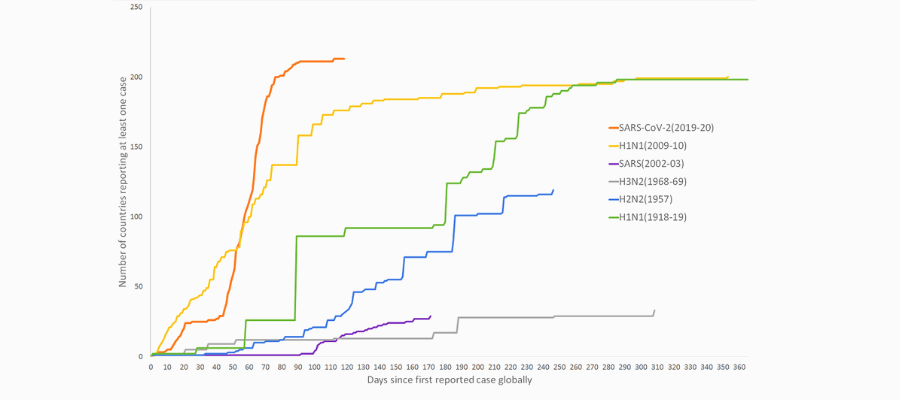
To quantify trends in the speed of spread of outbreaks, we gathered data on the timings of reported first cases in each country for a set of pandemics over the past century as part of ongoing work. Plotting the number of countries reporting cases cumulatively since the first reported case globally gives an indication of how rapidly and far each pathogen spread (Figure 2). The graph shows that it has taken only around 70 days for SARS-CoV-2 to reach nearly every country in the World – a speed that outpaces all the other pandemics studied, and only the recent H1N1 swine flu pandemic comes close.
What is driving these trends? It’s always difficult to rigorously compare pandemics for many reasons and multiple different factors interact to determine how, why and when a pathogen spreads. The infectiousness and other features of the pathogen, the susceptibility of different populations, surveillance and testing abilities, the implementation of available pharmaceutical and non-pharmaceutical interventions and health system capacities, among many other aspects, determine variations. One factor that does consistently stand out however in being key to driving accelerated pathogen spread is our growing global connectivity, and the movement of people on this network.
Human mobility increases
In just a few generations, we have moved from a global population where long distance travel was only the preserve of the most adventurous and well-resourced, to one where international travel is within reach of the majority. To illustrate the changes that have occurred in many high income countries, malariologist David Bradley mapped out the travel life histories of four generations of his family, shown in figure 3.
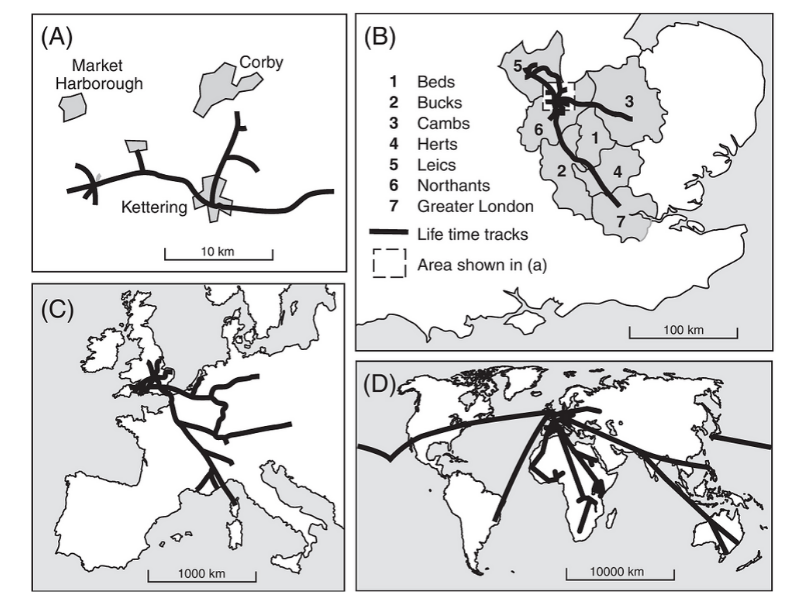
The maps in figure 3 represent a sample size of just one family (and a family containing an international malariologist who made many trip to Africa), so should not be taken as representative of the world or even a country, but the trends it represents are recognizable and important. Just three generations back, even in the high income regions of the world, the general population travelled little further than their home town. As a result, so did any pathogens they carried. Fast forward just a few decades and long distance public transport, motor vehicles and international air travel has become affordable for a large part of the growing global population. International air travel in particular has seen explosive growth over the past half century, as illustrated in figure 4.
In 1933, the commercial air industry was in its infancy, with a journey from London to Cape Town taking as much as a month, including more than ten stops and a far higher chance of crashing along the way. Though it may look different post-COVID-19 pandemic, the modern air travel network shown in figure 4 dwarfs its 1933 predecessor, and not only are the number of routes substantially larger, but the passenger traffic on them is thousands of times higher. Even if only a very small fraction of flights on these routes are carrying an infected passenger, you can quickly see how COVID-19 has ended up everywhere so quickly. On the scale of human history, very suddenly a disease outbreak in many parts of the planet can become a problem for the other side of the planet within days, with the growing numbers of people travelling providing ever greater numbers of opportunities for a pathogen looking to spread and reproduce.
Without a vaccine or effective drugs, the travel restrictions and social distancing measures that many governments have put in place for COVID-19 are effectively turning the generational travel clock shown in figure 3 back in time from map D to maps A or B. The aim of these restrictions is primarily to reduce impacts on health systems and slow the spread of the virus, and they have proven effective, likely slowing down the movement of the virus to the kind of speeds seen in figure 1 for many countries. Being able to measure, map and monitor these population mobility changes have therefore come to the fore in this ongoing pandemic, and will likely remain as an important focus for planning responses to future pandemics.
Measuring and mapping mobility
We must expect that more disease outbreaks will become global pandemics, and that an emerging disease thousands of miles away can quickly end up on our doorstep. Nevertheless, global connectivity and mobility patterns are not uniform, and being able to quantify these to understand likely routes and speed of spread of pathogens are a valuable tool in pandemic preparedness, as well as during outbreaks. While diseases are spreading more rapidly than ever before, our abilities to measure and anticipate this spread are improving rapidly too through integrating a range of datasets to capture mobility. These include mobile phone call records, smartphone location histories and flight passenger data, all aggregated and anonymized to protect the privacy of users. Each source has its own biases, but by comparing and integrating these with connectivity and change metrics derived from road networks, satellites, censuses and migration statistics, for example, we can build a more complete picture of movement patterns over space and time.
With disease spread globally accelerating, we will need to use such datasets on mobility to look at the planet through the lens of a newly emergent pathogen and its opportunities to spread. Without this, we will always be one step behind, chasing diseases as they ride with us across an increasingly connected World.
About the author: Professor Andrew Tatem is Professor of Spatial Demography and Epidemiology at the University of Southampton and is Director of WorldPop and Flowminder. His research has led to pioneering approaches to the use and integration of satellite, survey, cell phone and census data to map the distributions of vulnerable populations for disease, disaster and development applications.
Suggested further readings
Bowen Jr, J.T., and Laroe, C. (2006), Airline networks and the international diffusion of severe acute respiratory syndrome (SARS). Geographical Journal. doi:10.1111/j.1475-4959.2006.00196.x
Budd, L., Bell, M. and Warren, A. (2011). Maintaining the sanitary border: air transport liberalisation and health security practices at UK regional airports. Transactions of the Institute of British Geographers. doi:10.1111/j.1475-5661.2010.00424.x
